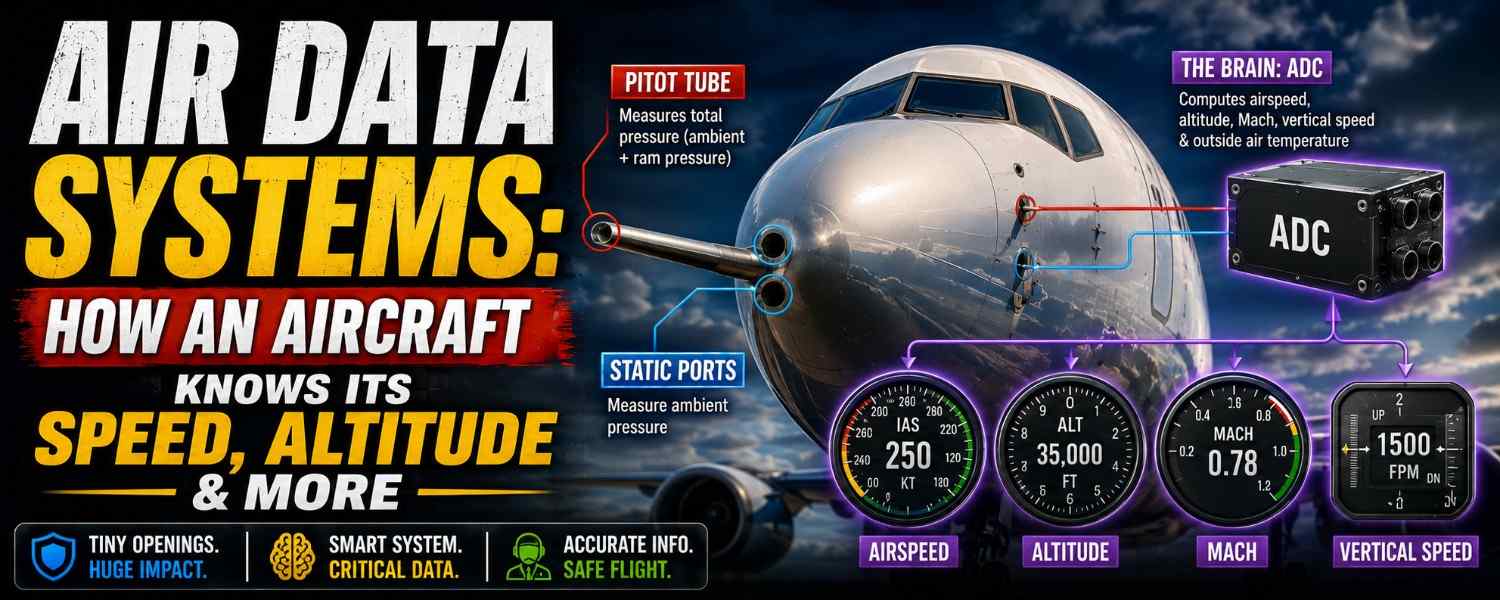
An aircraft has no speedometer cable, no GPS-style altitude lookup, no measuring tape to the ground. Everything it knows about speed and height, it learns by feeling the air itself.
Air data systems measure the aircraft’s interaction with the atmosphere — the pressures and temperature of the air flowing past — and convert those measurements into the critical numbers pilots and flight computers rely on to fly safely: airspeed, altitude, vertical speed, Mach number, and more.
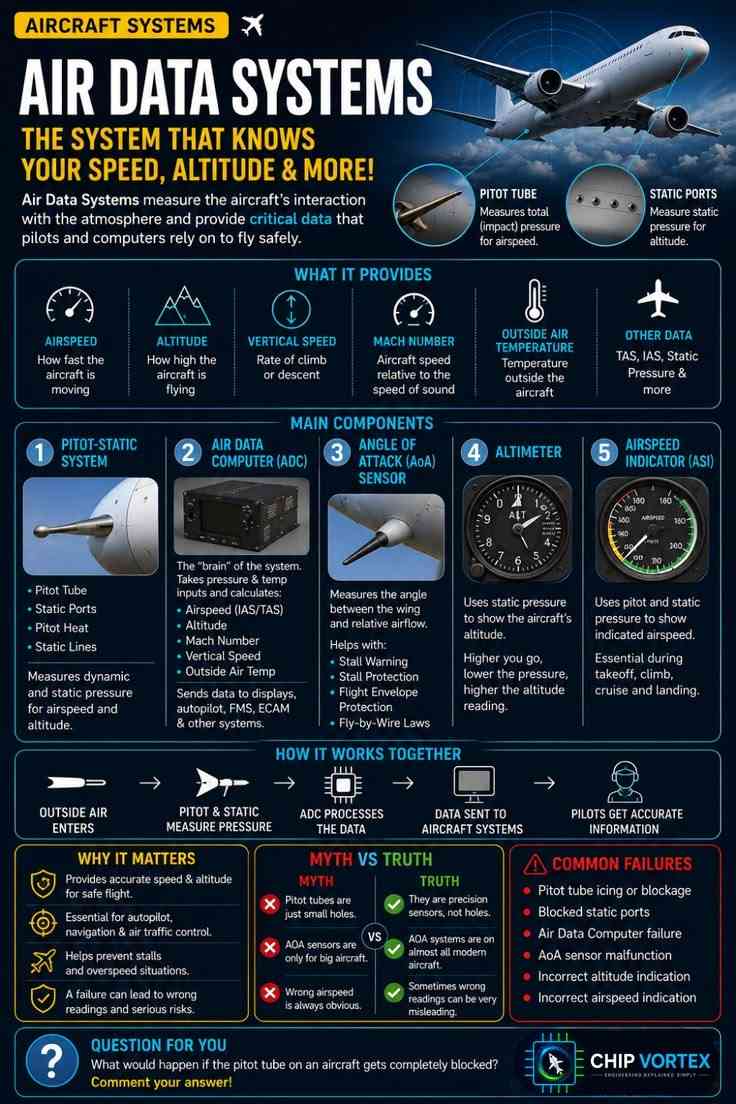
Save the chart for revision, then let’s see how a few pressure measurements become everything the cockpit knows.
🔧 Try It Yourself: Interactive Air Data System Simulator
What the Air Data System Provides
Six outputs, feeding nearly every other system on the aircraft: airspeed (how fast the aircraft moves through the air), altitude (how high it’s flying), vertical speed (the rate of climb or descent), Mach number (speed relative to the speed of sound — the number that matters at cruise), outside air temperature, and the supporting values behind them — indicated airspeed, true airspeed, static pressure, and more. Remarkably, almost all of it is derived from just two pressure measurements and a temperature probe.
The 5 Main Components
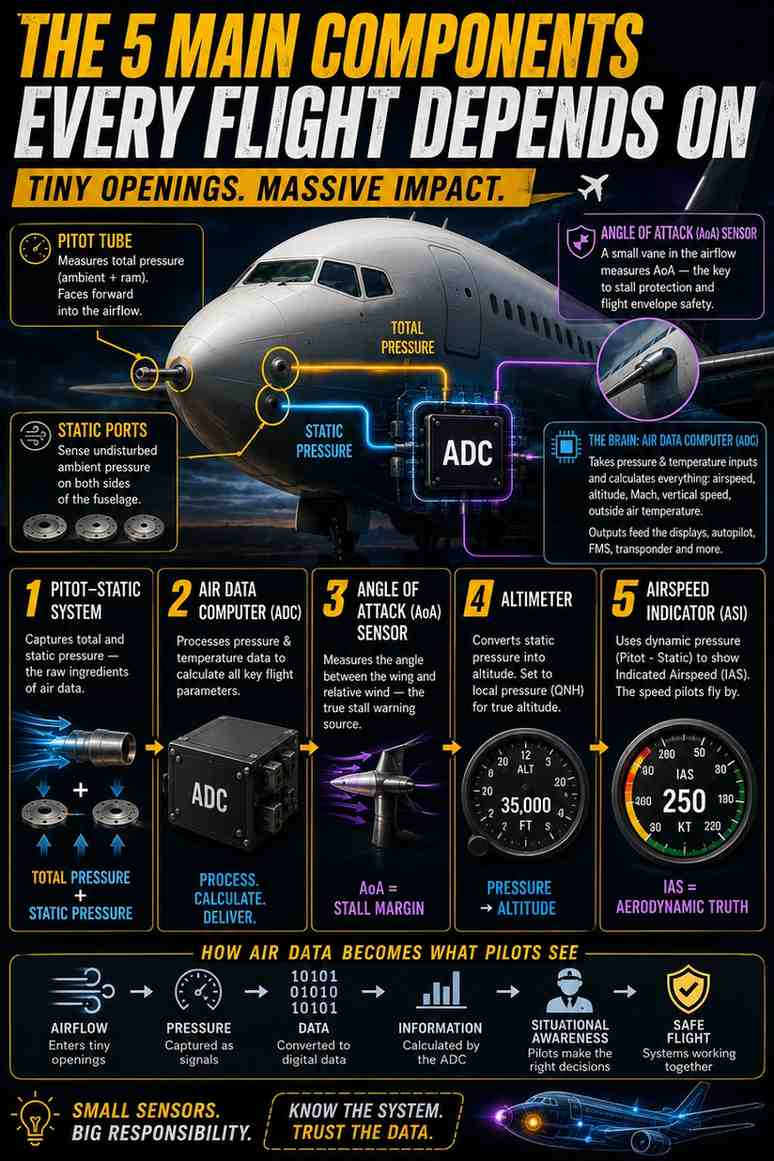
1. Pitot-Static System
The raw sensors of the whole operation. The pitot tube faces forward into the airflow and captures total pressure — the ambient air pressure plus the ram pressure of motion. The static ports sit flush on the fuselage sides, sensing the undisturbed ambient pressure alone; they’re usually installed on both sides and averaged, so a slight sideslip doesn’t skew the reading. Pitot heat electrically warms the probe to stop ice from sealing it shut, and the static lines are the plumbing that carries both pressures to the instruments and computers. Every air data number the aircraft produces begins right here, at these small openings in the metal.
2. Air Data Computer (ADC)
The brain of the system. The ADC takes the pressure inputs and the temperature probe’s data and calculates the full set: indicated and true airspeed, altitude, Mach number, vertical speed, and outside air temperature. On modern airliners it’s often integrated with the inertial platform into a single unit called an ADIRU. Its outputs feed the cockpit displays, the autopilot, the Flight Management System, the aircraft’s monitoring systems — and the transponder, which means the altitude air traffic control sees on radar comes from this computer. When the ADC speaks, everyone listens.
3. Angle of Attack (AoA) Sensor
A small vane on the forward fuselage that weathervanes into the airflow, measuring the angle between the wing and the relative wind. This angle is aerodynamics’ most important number: a wing always stalls at its critical angle of attack — regardless of airspeed — so AoA is the true measure of stall margin. The sensor feeds the stall warning system, stall protection, flight envelope protection, and the fly-by-wire control laws that quietly keep the aircraft inside safe limits. Modern aircraft carry multiple AoA vanes and cross-compare them continuously.
4. Altimeter
The altimeter is a precision barometer with a clever scale: static pressure falls predictably as you climb, so the instrument converts pressure into altitude. The higher you go, the lower the pressure, the higher the reading. One detail every student learns early: pilots must set the altimeter to the local pressure (QNH) for it to read true altitude — and at higher levels everyone switches to the same standard setting, which is why cruise altitudes are called flight levels. FL350 on the FMS screen means 35,000 feet on the standard setting.
5. Airspeed Indicator (ASI)
The ASI reads the difference between pitot and static pressure — the dynamic pressure of motion — and displays it as indicated airspeed (IAS). Here’s the subtlety: at high altitude the air is thin, so true airspeed (TAS) is considerably higher than indicated. Both matter, for different reasons — IAS is the aerodynamic truth the wing feels (stall speeds and structural limits live in IAS), while TAS is the real speed through the air mass that navigation cares about. From takeoff roll to landing flare, the ASI is the instrument pilots’ eyes return to most.
How It Works Together: 5 Steps
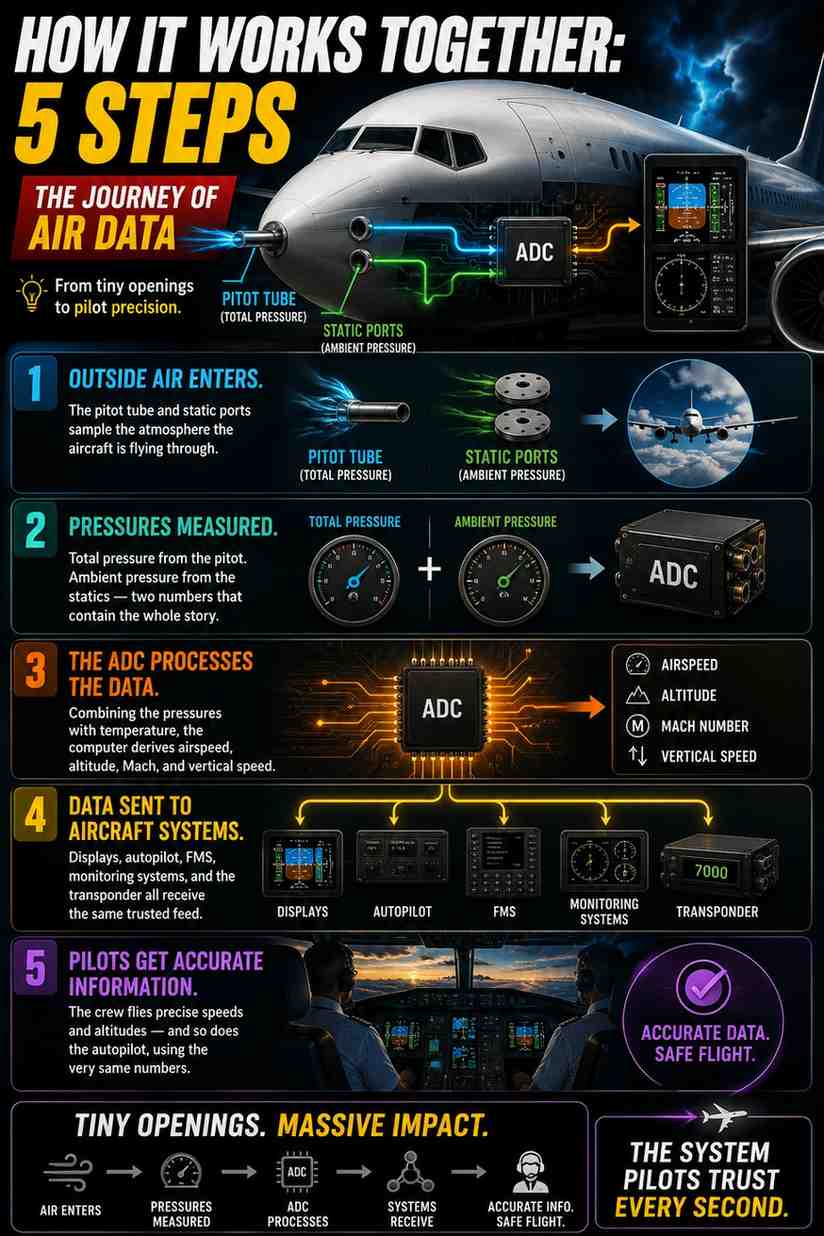
Step 1 — Outside air enters. The pitot tube and static ports sample the atmosphere the aircraft is flying through.
Step 2 — Pressures measured. Total pressure from the pitot, ambient pressure from the statics — two numbers that contain the whole story.
Step 3 — The ADC processes the data. Combining the pressures with temperature, the computer derives airspeed, altitude, Mach, and vertical speed.
Step 4 — Data sent to aircraft systems. Displays, autopilot, FMS, monitoring systems, and the transponder all receive the same trusted feed.
Step 5 — Pilots get accurate information. The crew flies precise speeds and altitudes — and so does the autopilot, using the very same numbers.
Why It Matters
Accurate speed and altitude are the bedrock of safe flight — every climb, cruise level, approach speed, and separation from other traffic depends on them. The air data feed is essential to the autopilot, to navigation, and to air traffic control, which builds its entire picture from the altitudes aircraft report. It’s also the system that helps prevent both stalls and overspeeds, warning the crew as the aircraft approaches either edge of its envelope. And the reverse is equally true: when air data goes wrong, the readings don’t just disappear — they lie, which is why this system is engineered with such redundancy and respect.
Myth vs Truth
Myth: pitot tubes are just small holes. Truth: they’re precision sensors — carefully shaped, positioned in clean airflow, electrically heated, and calibrated. The “hole” is the least important part.
Myth: AoA sensors are only for big aircraft. Truth: AoA systems fly on almost all modern aircraft, and stall-warning vanes based on the same principle have protected light trainers for decades.
Myth: wrong airspeed is always obvious. Truth: erroneous readings can be deeply misleading — instruments may disagree with each other in confusing ways rather than failing cleanly. Aviation learned this at terrible cost: the Air France 447 accident in 2009 began with iced-over pitot probes and unreliable airspeed at night over the Atlantic. It’s why crews now drill unreliable airspeed procedures: set a known pitch and power, and the aircraft will fly safely while the problem is sorted out.
Common Failures — and the Lessons Behind Them
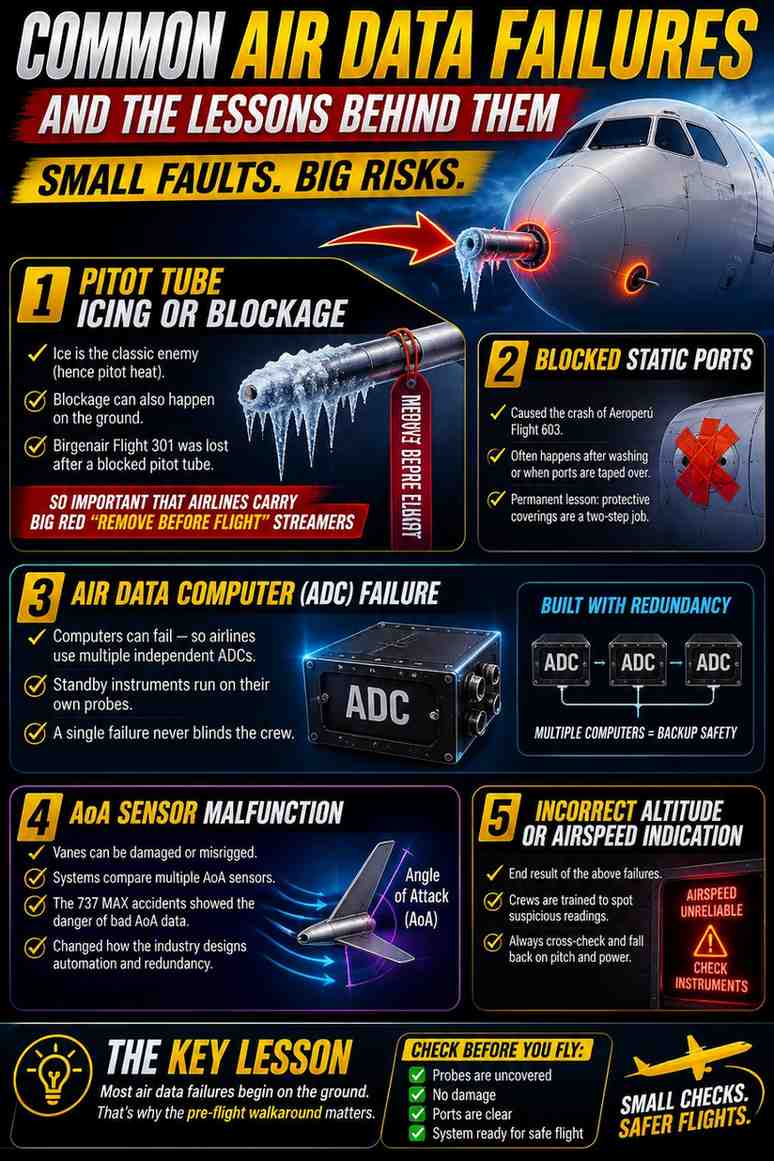
Pitot tube icing or blockage. Ice is the classic enemy (hence pitot heat), but blockages have other sources too — Birgenair Flight 301 was lost after a pitot tube was likely obstructed while the aircraft sat in storage, which is why pitot covers exist and why they carry big red Remove Before Flight streamers.
Blocked static ports. Aeroperú Flight 603 crashed after static ports were left taped over following aircraft washing — protective tape that was never removed. For maintenance personnel, it’s the permanent lesson: protective coverings are a two-step job, and the second step is the one that counts.
Air Data Computer failure. Met with redundancy: airliners carry multiple independent air data computers plus standby instruments running on their own separate probes, so a single failure never blinds the crew.
AoA sensor malfunction. Vanes can be damaged or misrigged, and systems cross-compare multiple sensors to catch it. The industry’s most scrutinized recent lesson — the 737 MAX accidents — involved erroneous AoA data driving automated nose-down commands, and it reshaped how the whole industry thinks about sensor redundancy and automation design.
Incorrect altitude or airspeed indication. The end result of any of the above — and the reason crews train to recognize suspicious readings, cross-check independent sources, and fall back on pitch and power.
There’s a thread running through all of these: most air data failures begin on the ground. It’s exactly why the pre-flight walkaround exists — checking that probes are uncovered, undamaged, and clear is one of the highest-value minutes in aviation maintenance.
FAQ: Air Data Systems
What would happen if the pitot tube got completely blocked?▾
The trapped pressure stops responding to speed changes, and the airspeed indicator starts behaving like an altimeter: climb and the indicated airspeed appears to increase, descend and it appears to decrease — dangerously misleading in exactly the phases where accurate speed matters most. Pitot heat and pre-flight checks exist to make sure it never happens.
What’s the difference between the pitot tube and static ports?▾
The pitot tube captures total pressure (ambient plus the ram pressure of motion); static ports capture ambient pressure alone. Their difference gives airspeed; static pressure by itself gives altitude and vertical speed.
What’s the difference between IAS and TAS?▾
Indicated airspeed is what the dynamic pressure says — the aerodynamic truth the wing feels. True airspeed is the actual speed through the air, which grows well above IAS at altitude as the air thins. Fly limits by IAS; navigate by TAS.
What does the angle of attack sensor actually do?▾
It measures the angle between the wing and the oncoming air — the number that determines stall. Because a wing stalls at its critical AoA at any speed, this sensor drives the stall warnings and protections that keep the aircraft inside its envelope.
Why do pilots keep adjusting the altimeter setting?▾
Because atmospheric pressure varies from place to place and hour to hour. Setting the local pressure (QNH) makes the altimeter read true altitude; at higher levels everyone switches to the same standard setting so all traffic measures altitude identically.
So — now you know what a blocked pitot tube really does. Head to the comments and tell us how you’d explain it to a friend in one sentence. Save the chart to your aviation board, and continue the Aircraft Systems Series with the Navigation System and the Flight Management System.